

Reports
Generate comprehensive reports and export data about various facets of your organization to help you determine daily cash changes, account days-traded, and more.
Note: The reporting API can experience performance issues when it’s being used by multiple users simultaneously and report requests time out if generation takes longer than 3 minutes (for example, reports with a million rows).
BigQuery does not have these limitations, so we recommend using BigQuery to access your reports and data.
Accessing Reports
To access the Reports portion of the Dashboards application, click the Report tab on the navigation column. You’ll see a palette of available reports for Organization Admins.
Best Practice: Reports are intended to be run EOD (End of Day) during market close. This allows for all of the values for the day’s session to be settled, giving you the most accurate data.
How to Construct a Report
Each report request is composed of a report type and parameters. You can see the parameters available for a report type by selecting one of the options from the reports palette.
Report Generation Options
Generate Report
Constructs the report and displays it in-page for you to view.
Download CSV
Constructs the report and downloads it in CSV format. You can then utilize that data, or view it in Excel and other spreadsheet viewing tools.
Download PDF
Constructs the report and downloads it in PDF format. This will include a table of the results for you to view in PDF format.
View Last Report
Dashboards caches recent searches locally. This allows you to look at history, including things like the last generated report. This can be useful for comparing the results of two report queries quickly, or cross referencing another report.
Account Balance History Report
Account Balance History can be incredibly useful for finding the number of days traded for an account, an account’s creation date (will show $0.00 P/L), or recording the progress made during the last trading session.
Account Balance History Parameters
Date
The time frame to pull data from. You can select a custom range if the predefined ranges don’t suit your current needs.
Day/Range
Allows you to enter a day or date range from which to gather report data.
Account (Optional)
You can optionally filter by a single account. Leaving this filter empty will result in querying all accounts that had a balance change over the date range.
Understanding Account Balance Results
$0.00 Total Realized P&L
Usually means this was the creation date for the account, and that it hasn’t traded yet.
Any Other Value for Total Realized P&L
Means this account traded during the requested session range.
Total Amount
The EOD balance (given that you are calling this report between 5-6PM ET).
Trade Date
The trading session date not the calendar date.
User Sessions Report
A User Session report contains information about when a user logged in and from what device. This can be useful when a user makes a claim that someone else has been using their account.
User Sessions Parameters
Date
The time frame to pull data from. Custom ranges are supported.
Day/Week
Dependent on the Date selection, allow you to choose the day or week.
From and To
Dependent on your Date selection, allow for custom ranges within the chosen day.
User
The User to pull session data for.
Understanding User Session Results
Session Information
Shows session start and stop times to easily audit the timeframe from a claim.
Device ID and IP Address
Compare the listed Device IDs and IP Addresses to see if there is an outlying device or an unusual IP.
App Name
Refers to the application used. tradovate_trader(web) is the Tradovate Web Trader. The app will be different depending on which application the client is using (Tradovate or NT Desktop, NT Web, Mobile, etc).
Detecting Manual vs Automated Trading
The User Sessions report can help determine whether orders were placed manually or via automated trading systems. Use the “App Names” column to identify the platform used:
Manual Trading Platforms:
- tradovate_trader(web) or tradovate_trader(desktop) - Manual point-and-click trading
- Tradingview - Manual chart-based trading
- Pulse or Voyager (mobile apps) - Manual mobile trading
Automated Trading Indicators:
- NinjaTrader - May include automated strategies (requires additional investigation)
- TradersPost Production Env, AutoView, etc. - Bridge providers connecting automated strategies
Investigation Process:
- Check the User Sessions report for the “App Names” column
- If only manual platforms are listed, orders were likely placed manually
- If automated indicators appear, use the Orders report to find specific order numbers
- Use the Order Details report to confirm which “device” sent the orders
- For NinjaTrader, request NT8 Log & Trace files to confirm automated vs manual trading
Bridge Provider Detection: Bridge providers like “TradersPost Production Env” or “AutoView” typically offer connections between TradingView and Tradovate via WebHooks, allowing automated strategies to send trading signals. When these appear in session history, review the specific orders to confirm automated execution.
Report Best Practices
Timing
Run reports during market close (5-6PM ET) for the most accurate EOD data.
Data Export
Use CSV format for further analysis in Excel or other tools. Use PDF format for documentation and record-keeping.
Historical Comparison
Use “View Last Report” to compare results between different time periods or parameters.
Custom Ranges
Use custom date ranges when predefined ranges don’t meet your specific needs.
Investigating Trading Issues
Gathering Information
When a user has a question regarding an order or trade, collect the following information before beginning your investigation:
Essential Information to Gather:
- Account number - The specific account involved in the issue
- Order number(s) - The exact order(s) in question
- Approximate timestamp - When the order was placed or the issue occurred
- Issue details - Specific description of the problem or question
Why This Information Matters:
- Account number enables you to filter reports and focus on the relevant account
- Order numbers allow you to trace specific orders through the Order Details report
- Timestamps help you narrow down the time range for your investigation
- Issue details provide context for determining which reports to use and what to look for
This information gathering step ensures you have everything needed to effectively use the available reports for troubleshooting and investigation.
Which Report to Use
There are several reports that should be used when reviewing questions involving trades. The type of question will determine which report(s) should be referenced.
Orders Report
The most frequently used report when reviewing order submission cases. These will include:
- Searching by account number and date(range) to see what trading activity took place
- Finding the order(s) in question by looking at the timestamps and/or fill prices
- Checking when a position was auto-liquidated
Order Details
This report will often act as an extension of the Order report. The order number can be found in the Orders report, which is what needs to be entered in the Order Details report. The result will provide:
- When an order was placed
- Which platform type, user, and from which IP address it was sent
- A history of the order, when it was placed, modified, cancelled, rejected, filled, etc.
- Knowing when an order was placed and cancelled can be useful when wanting to know which specific orders were working at a specific time.
Cash History
This report shows the account’s cash balance activity. It will provide entries when, for example, a position is closed (Trade Paired), and commissions or any other fees are deducted. A use case for this report would be to find Start and End Of Day balances.
Performance
This report will show the accounts’ performance for the specified date(range). This will allow you to:
- Quickly see total P/L (with and without commissions) for the specified date(range)
- See the number of contracts and sides traded
- Find each trade’s entry and exit time, fill price, and P/L
Activity Log
When looking to review user’s actions within the Tradovate platform, this report can be used. It will log actions such as when:
- When orders are placed, modified, and cancelled
- How orders are placed (via which module).
- Whether ATM strategies are enabled, and if so, the specific ATM template name applied
- When specific Group Trade templates are enabled or disabled.
Common Order Investigation Scenarios
The most common order-related support cases involve orders that were inadvertently left working. A trader closes a position but doesn’t cancel the associated protective orders (stop loss, take profit). Those orders can fill later, opening an unintended position that may be auto-liquidated.
The Orders Report is the best tool for investigating these cases. Focus on these columns:
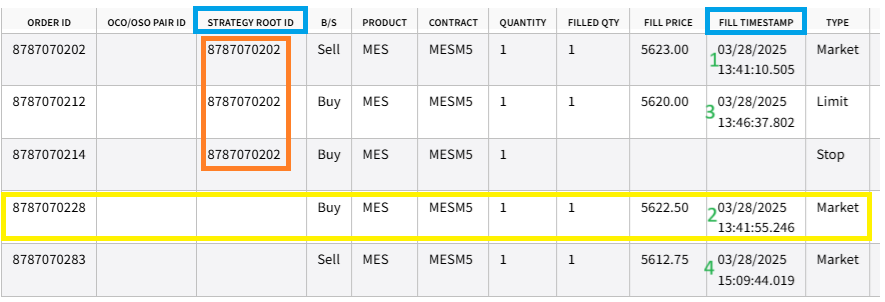
- Fill Timestamp: When orders were filled
- Strategy Root ID: Groups an entry order with its associated bracket orders (e.g., entry, stop loss, and take profit); if populated, the order used an ATM strategy with linked protective orders
- Text: Shows how the order was placed, including
AutoLiqfor orders triggered by the auto-liquidation system - AutoLiq Initiator: Shows
Customerwhen the liquidation was triggered by the trader’s own activity breaching risk limits
Example: Working Orders from an ATM Strategy
In this scenario, a trader closes their position manually but doesn’t cancel the ATM strategy’s protective orders. One of those orders fills later, opening an unintended position.
Example: A trader sold 1 MESM5 at 13:41:10 (order 8787070202), then bought to close at 13:41:55. The ATM strategy’s take-profit and stop-loss orders (8787070212 and 8787070214) were still working. At 13:46:37, the buy limit (take profit) filled, opening an unintended long position that was ultimately auto-liquidated.
The Strategy Root ID column confirms these orders are linked: order 8787070202 is the parent entry order, and the take-profit and stop-loss orders share the same Strategy Root ID. Because ATM strategy orders are linked as OCO (one cancels the other), filling one automatically cancels the other. When the buy limit filled, the working stop loss was cancelled.
Conclusion: The unintended position was opened because the trader didn’t cancel the ATM strategy’s working protective orders after manually closing their position.
Example: Unlinked Protective Orders
When a trader places protective orders manually (without an ATM strategy), those orders are not linked. If one fills, the other remains working and can fill later.
Compare the two setups in the Orders Report:
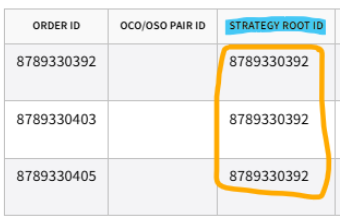
- ATM strategy (linked): The Strategy Root ID column contains an ID matching the entry order. The take-profit and stop-loss orders are OCO-linked, so filling one automatically cancels the other.
- Manual orders (unlinked): The Strategy Root ID column is blank. The stop-loss and take-profit orders are independent. If the stop loss fills, the take profit remains working and can fill later, potentially opening a new position.

What to Recommend to Users
When users report unexpected positions caused by working orders, you can recommend they:
- Keep both the Orders and Positions modules open in their Tradovate workspace
- Review both modules when done trading to confirm there are no open positions or working orders
- Filter the Orders module by order state to quickly identify any working orders
To add these modules, use the Add Modules icon in the upper right corner of the platform and drag the modules into the workspace.
Investigating Auto-Liquidations
When troubleshooting auto-liquidation issues, the account dashboard can help you determine what triggered the liquidation. For details on configuring risk settings, see Post-Trade Risk.
Account Dashboard Investigation:
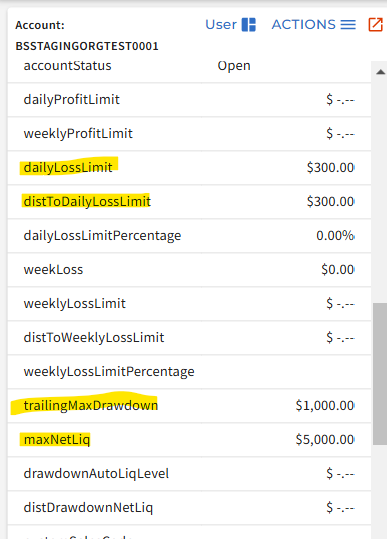
- Use the account dashboard and the account grid in the left pane to see an account’s post-trade risk rules
- Check the
maxNetLiqvalue and compare it to the current account balance - Review
trailingMaxDrawdownsettings and daily loss limit configurations - Analyze
distToDailyLossLimitvalues to understand liquidation triggers
Key Dashboard Fields for Risk Analysis:
maxNetLiq: The high watermark of the account value (highest balance reached)trailingMaxDrawdown: The maximum drawdown allowed from the high watermarkdistToDailyLossLimit: Distance to daily loss limit (negative values indicate limit exceeded)netLiq: Current account balance/net liquidity
Investigation Process:
- Navigate to the account dashboard for the affected account
- Review the account grid in the left pane for risk parameters
- Compare current balance (
netLiq) with risk thresholds - Check if trailing max drawdown or daily loss limits were triggered
- Use the calculated thresholds to determine the cause of auto-liquidation
This dashboard-based investigation approach can help identify whether auto-liquidations were caused by:
- Trailing max drawdown violations
- Daily loss limit breaches
- Combination of multiple risk parameters
- RealTime vs end-of-day rule differences
Example: Trailing Max Drawdown Breach
In this example, an account has a trailing max drawdown of $1,000. If the account value falls more than $1,000 from its highest value, auto-liquidation triggers. When trailingMaxDrawdownMode is set to RealTime, the maxNetLiq value updates as soon as the account value reaches a new high. When set to EOD, it updates based on the cash balance at session close.
Before trading, trailingMaxDrawdown is $1,000 and maxNetLiq is $5,000 (the starting balance).
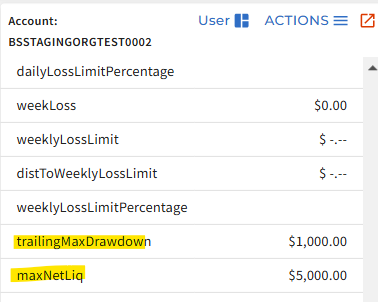
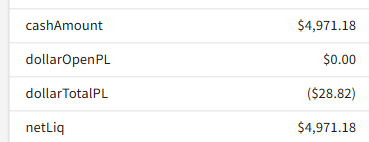
After trading, maxNetLiq increased to $5,975.26 (the highest value the account reached). The auto-liquidation threshold is:
$5,975.26 (
maxNetLiq) - $1,000 (trailingMaxDrawdown) = $4,975.26
The account’s netLiq dropped to $4,971.18, just below the $4,975.26 threshold, triggering auto-liquidation.
Example: Daily Loss Limit Breach
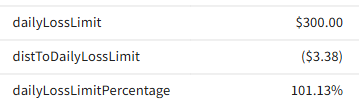
In this example, an account has both a daily loss limit (DLL) of $300 and a trailing max drawdown (TMD) of $1,000. The DLL triggers if the total loss since the start of the session exceeds $300. The TMD triggers if the account value drops more than $1,000 from its highest value.
Before trading, the starting balance is $5,000 with both risk rules active.
After trading, the session’s total loss exceeded $300, triggering the daily loss limit. The distToDailyLossLimit field shows a negative value, confirming the limit was breached. In this example, the total session loss was $303.38 ($300 limit + $3.38 overage).
After an Auto-Liquidation
A daily loss limit breach does not mean the account has failed. Only a trailing max drawdown breach indicates account failure. This distinction determines whether you should revoke the account’s trading permissions.
The Admin Alert message text says “Daily Loss Limit” regardless of which rule triggered. Use the qualifiers in the message to determine the cause:
Whether the account automatically unlocks after auto-liquidation depends on the doNotUnlock field in the account’s post-trade risk configuration. When doNotUnlock is false, the account unlocks automatically at the next session start. When doNotUnlock is true, the account stays locked until you call setAdminAutoLiqAction to unlock it.
Programmatic Report Generation
Organization admins have access to the undocumented reporting API. You can use this API to get CSV data about your user’s accounts; historical data about Performance, Orders, Positions, Subscriptions and more is available via reports.
Reporting API Domains
There are two domains, live and demo (just like the rest of the API), as well as development variants:
Production:
https://rpt-live.tradovateapi.com/v1https://rpt-demo.tradovateapi.com/v1
Development:
https://rpt-live.staging.ninjatrader.dev/v1https://rpt-demo.staging.ninjatrader.dev/v1
To retrieve data about sim accounts for example, you would use the rpt-demo or rpt-demo-d variants.
Getting Started with Programmatic Reports
First, using one of the above URLs as a base, make a request to /reports/requestReportDefinitions. You should receive a list of report types. These are all of the reports available to your admin user.
Example Report Definition:
Report Request Format
- name is the report name that can be requested. You will need to use this value to specify the report you are requesting.
- params are an array of descriptors. You will need to pass an object for each of the non-optional parameters described here.
- fields describe the schema of the returned CSV. Additionally there are template types, but these are for PDF and HTML representations, which typically our business partners are not interested in.
Example Report Request:
This will return all of the Tradovate Subscription entities related to your organization during the month of August, 2022.
Important Notes:
- If you want CSV, be sure to include the
representationType: "csv"field. - The timezone field will adjust the time representation to the local numeric designation.
- Params must be designated as
\{ name: string, value: ValueType \}objects, where ValueType is determined by the parameter descriptor from the report definition.